DP-900 Part 1

Over the last few decades, the amount of data that systems, applications, and devices have generated has increased significantly. Data is everywhere. Data is available in different structures and formats. Understanding data and exploring it reveals interesting facts, and helps you gain meaningful insights.
In this module, you'll learn about how you can organize and process data. You'll learn about relational and non-relational databases, and how data is handled through transactional processing, and through batch and streaming data processing.

Imagine you're a data analyst for a large consumer organization. The organization wants to understand customer buying patterns from supermarkets. The organization has a number of datasets from different sources, such as till information (point of sale), weather data, and holiday data. The organization would like to use Azure technologies to understand and analyze these datasets.
Learning objectives
In this module you will:
- Identify how data is defined and stored
- Identify characteristics of relational and non-relational data
- Describe and differentiate data workloads
- Describe and differentiate batch and streaming data
Identify the need for data solutions
What is data?

Data is a collection of facts such as numbers, descriptions, and observations used in decision making.
You can classify data as structured, semi-structured, or unstructured.

Structured data is typically tabular data that is represented by rows and columns in a database.
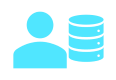
Databases that hold tables in this form are called relational databases (the mathematical term relation refers to an organized set of data held as a table). Each row in a table has the same set of columns. The image below illustrates an example showing two tables in an ecommerce database. The first table contains the details of customers for an organization, and the second holds information about products that the organization sells.

There are other types of semi-structured data as well. Examples include key-value stores and graph databases.

A key-value store is similar to a relational table, except that each row can have any number of columns.
You can use a graph database to store and query information about complex relationships. A graph contains nodes (information about objects), and edges (information about the relationships between objects). The image below shows an example of how you might structure the data in a graph database.

Not all data is structured or even semi-structured. For example, audio and video files, and binary data files might not have a specific structure. They're referred to as unstructured data.
How is data defined and stored in cloud computing?
Depending on the type of data such as structured, semi-structured, or unstructured, data will be stored differently.
Structured data is typically stored in a relational database such as SQL Server or Azure SQL Database.

You can use it to create and access relational tables.
The service is managed and run by Azure, you just specify that you want a database server to be created.

The act of setting up the database server is called provisioning.
You can provision other services as well in Azure. For example,

if you want to store unstructured data such as video or audio files, you can use Azure Blob storage (Blob is an acronym for Binary Large Object).

If you want to store semi-structured data such as documents, you can use a service such as Azure Cosmos DB.

After your service is provisioned, the service needs to be configured so that users can be given access to the data. You can typically define several levels of access.

Read-only access means the users can read data but can't modify any existing data or create new data.
Read/write access gives users the ability to view and modify existing data.
Owner privilege gives full access to the data including managing the security like adding new users and removing access to existing users.
You can also define which users should be allowed to access the data in the first place. If the data is sensitive (or secret), you may want to restrict access to a few select users.

Data processing solutions often fall into one of two broad categories: analytical systems, and transaction processing systems.
What is a transactional system?
A transactional system is often what most people consider the primary function of business computing. A transactional system records transactions.
A transaction could be financial, such as the movement of money between accounts in a banking system, or it might be part of a retail system, tracking payments for goods and services from customers. Think of a transaction as a small, discrete, unit of work.
Transactional systems are often high-volume, sometimes handling many millions of transactions in a single day. The data being processed has to be accessible very quickly. The work performed by transactional systems is often referred to as Online Transactional Processing (OLTP).

To support fast processing, the data in a transactional system is often divided into small pieces. For example, if you're using a relational system each table involved in a transaction only contains the columns necessary to perform the transactional task.
In the bank transfer example, a table holding information about the funds in the account might only contain the account number and the current balance. Other tables not involved in the transfer operation would hold information such as the name and address of the customer, and the account history. Splitting tables out into separate groups of columns like this is called normalized.
The next unit discusses this process in more detail. Normalization can enable a transactional system to cache much of the information required to perform transactions in memory, and speed throughput.
While normalization enables fast throughput for transactions, it can make querying more complex. Queries involving normalized tables will frequently need to join the data held across several tables back together again. This can make it difficult for business users who might need to examine the data.
What is an analytical system?
In contrast to systems designed to support OLTP, an analytical system is designed to support business users who need to query data and gain a big picture view of the information held in a database.
Analytical systems are concerned with capturing raw data, and using it to generate insights. An organization can use these insights to make business decisions. For example, detailed insights for a manufacturing company might indicate trends enabling them to determine which product lines to focus on, for profitability.

Most analytical data processing systems need to perform similar tasks:
- data ingestion
- data transformation
- data querying
- data visualization.

Data Ingestion: Data ingestion is the process of capturing the raw data. This data could be taken from control devices measuring environmental information such as temperature and pressure, point-of-sale devices recording the items purchased by a customer in a supermarket, financial data recording the movement of money between bank accounts, and weather data from weather stations. Some of this data might come from a separate OLTP system. To process and analyze this data, you must first store the data in a repository of some sort. The repository could be a file store, a document database, or even a relational database.
Data Transformation/Data Processing: The raw data might not be in a format that is suitable for querying. The data might contain anomalies that should be filtered out, or it may require transforming in some way. For example, dates or addresses might need to be converted into a standard format. After data is ingested into a data repository, you may want to do some cleaning operations and remove any questionable or invalid data, or perform some aggregations such as calculating profit, margin, and other Key Performance Metrics (KPIs). KPIs are how businesses are measured for growth and performance.
Data Querying: After data is ingested and transformed, you can query the data to analyze it. You may be looking for trends, or attempting to determine the cause of problems in your systems. Many database management systems provide tools to enable you to perform ad-hoc queries against your data and generate regular reports.
Data Visualization: Data represented in tables such as rows and columns, or as documents, aren't always intuitive. Visualizing the data can often be useful as a tool for examining data. You can generate charts such as bar charts, line charts, plot results on geographical maps, pie charts, or illustrate how data changes over time. Microsoft offers visualization tools like Power BI to provide rich graphical representation of your data.
Identify types of data and data storage
You can categorize data in many different ways, depending not only on how it's structured, but also on how the data is used. In this unit, you'll learn about the characteristics of different types of data.
Describe the characteristics of relational and non-relational data
Relational databases provide probably the most well-understood model for holding data.
The simple structure of tables and columns makes them easy to use initially, but the rigid structure can cause some problems. For example, in a database holding customer information, how do you handle customers that have more than one address? Do you add columns to hold the details for each address? If so, how many of these columns should you add? If you allow for three addresses, what happens if a customer has only one address? What do you store in the spare columns? What then happens if you suddenly have a customer with four addresses? Similarly, what information do you store in an address (street name, house number, city, zip code)? What happens if a house has a name rather than a number, or is located somewhere that doesn't use zip codes?
You can solve these problems by using a process called normalization. Typically, the end result of the normalization process is that your data is split into a large number of narrow, well-defined tables (a narrow table is a table with few columns), with references from one table to another, as shown in the image below. However, querying the data often requires reassembling information from multiple tables by joining the data back together at run-time (illustrated by the lines in the diagram). These types of queries can be expensive.

Non-relational databases enable you to store data in a format that more closely matches the original structure. For example, in a document database, you could store the details of each customer in a single document, as shown by the example in the previous unit. Retrieving the details of a customer, including the address, is a matter of reading a single document. There are some disadvantages to using a document database though. If two customers cohabit and have the same address, in a relational database you would only need to store the address information once. In the diagram below, Jay and Frances Adams both share the same address.

In a document database, the address would be duplicated in the documents for Jay and Francis Adams. This duplication not only increases the storage required, but can also make maintenance more complex (if the address changes, you must modify it in two documents).
## Document for Jay Adams ##
{
"customerID": "1",
"name":
{
"firstname": "Jay",
"lastname": "Adams"
},
"address":
{
"number": "12",
"street": "Park Street",
"city": "Some City",
}
}
## Document for Frances Adams ##
{
"customerID": "4",
"name":
{
"firstname": "Francis",
"lastname": "Adams"
},
"address":
{
"number": "12",
"street": "Park Street",
"city": "Some City",
}
}
Describe transactional workloads
Relational and non-relational databases are suited to different workloads. A primary use of relational databases is to handle transaction processing.
A transaction is a sequence of operations that are atomic. This means that either all operations in the sequence must be completed successfully, or if something goes wrong, all operations run so far in the sequence must be undone.
Bank transfers are a good example; you deduct funds from one account and credit the equivalent funds to another account. If the system fails after deducting the funds, they must be reinstated in the original account (they mustn't be lost). You can then attempt to perform the transfer again. Similarly, you shouldn't be able to credit an account twice with the same funds.
Each database transaction has a defined beginning point, followed by steps to modify the data within the database. At the end, the database either commits the changes to make them permanent, or rolls back the changes to the starting point, when the transaction can be tried again.
A transactional database must adhere to the ACID (Atomicity, Consistency, Isolation, Durability) properties to ensure that the database remains consistent while processing transactions.
Atomicity guarantees that each transaction is treated as a single unit, which either succeeds completely, or fails completely. If any of the statements constituting a transaction fails to complete, the entire transaction fails and the database is left unchanged. An atomic system must guarantee atomicity in each and every situation, including power failures, errors, and crashes.
Consistency ensures that a transaction can only take the data in the database from one valid state to another. A consistent database should never lose or create data in a manner that can't be accounted for. In the bank transfer example described earlier, if you add funds to an account, there must be a corresponding deduction of funds somewhere, or a record that describes where the funds have come from if they have been received externally. You can't suddenly create (or lose) money.
Isolation ensures that concurrent execution of transactions leaves the database in the same state that would have been obtained if the transactions were executed sequentially. A concurrent process can't see the data in an inconsistent state (for example, the funds have been deducted from one account, but not yet credited to another.)
Durability guarantees that once a transaction has been committed, it will remain committed even if there's a system failure such as a power outage or crash.
Database systems that process transactional workloads are inherently complex. They need to manage concurrent users possibly attempting to access and modify the same data at the same time, processing the transactions in isolation while keeping the database consistent and recoverable. Many systems implement relational consistency and isolation by applying locks to data when it is updated. The lock prevents another process from reading the data until the lock is released. The lock is only released when the transaction commits or rolls back. Extensive locking can lead to poor performance, while applications wait for locks to be released.

Distributed databases are widely used in many organizations. A distributed database is a database in which data is stored across different physical locations.
It may be held in multiple computers located in the same physical location (for example, a datacenter), or may be dispersed over a network of interconnected computers. When compared to non-distributed database systems, any data update to a distributed database will take time to apply across multiple locations. If you require transactional consistency in this scenario, locks may be retained for a very long time, especially if there's a network failure between databases at a critical point in time. To counter this problem, many distributed database management systems relax the strict isolation requirements of transactions and implement "eventual consistency." In this form of consistency, as an application writes data, each change is recorded by one server and then propagated to the other servers in the distributed database system asynchronously. While this strategy helps to minimize latency, it can lead to temporary inconsistencies in the data. Eventual consistency is ideal where the application doesn't require any ordering guarantees. Examples include counts of shares, likes, or non-threaded comments in a social media system.
Describe analytical workloads
Analytical workloads are typically read-only systems that store vast volumes of historical data or business metrics, such as sales performance and inventory levels. Analytical workloads are used for data analysis and decision making. Analytics are generated by aggregating the facts presented by the raw data into summaries, trends, and other kinds of “Business information.”
Analytics can be based on a snapshot of the data at a given point in time, or a series of snapshots. People who are higher up in the hierarchy of the company usually don't require all the details of every transaction. They want the bigger picture.
An example of analytical information is a report on monthly sales. As the head of sales department, you may not need to see all daily transactions that took place (transactional information), but you definitely would like a monthly sales report to identify trends and to make decisions (analytical information).
Transactional information, however, is an integral part of analytical information. If you don't have good records of daily sales, you can't compile a useful report to identify trends. That’s why efficient handling of transactional information is very important.
Describe the difference between batch and streaming data
Data processing is simply the conversion of raw data to meaningful information through a process. Depending on how the data is ingested into your system, you could process each data item as it arrives, or buffer the raw data and process it in groups. Processing data as it arrives is called streaming. Buffering and processing the data in groups is called batch processing.
Understand batch processing
In batch processing, newly arriving data elements are collected into a group. The whole group is then processed at a future time as a batch. Exactly when each group is processed can be determined in a number of ways. For example, you can process data based on a scheduled time interval (for example, every hour), or it could be triggered when a certain amount of data has arrived, or as the result of some other event.
An example of batch processing is the way that credit card companies handle billing. The customer doesn't receive a bill for each separate credit card purchase but one monthly bill for all of that month's purchases.
Advantages of batch processing include:
- Large volumes of data can be processed at a convenient time.
- It can be scheduled to run at a time when computers or systems might otherwise be idle, such as overnight, or during off-peak hours.
Disadvantages of batch processing include:
- The time delay between ingesting the data and getting the results.
- All of a batch job's input data must be ready before a batch can be processed. This means data must be carefully checked. Problems with data, errors, and program crashes that occur during batch jobs bring the whole process to a halt. The input data must be carefully checked before the job can be run again. Even minor data errors, such as typographical errors in dates, can prevent a batch job from running.
Understand streaming and real-time data
In stream processing, each new piece of data is processed when it arrives. For example, data ingestion is inherently a streaming process.
Streaming handles data in real time. Unlike batch processing, there's no waiting until the next batch processing interval, and data is processed as individual pieces rather than being processed a batch at a time. Streaming data processing is beneficial in most scenarios where new, dynamic data is generated on a continual basis.
Examples of streaming data include:
- A financial institution tracks changes in the stock market in real time, computes value-at-risk, and automatically rebalances portfolios based on stock price movements.
- An online gaming company collects real-time data about player-game interactions, and feeds the data into its gaming platform. It then analyzes the data in real time, offers incentives and dynamic experiences to engage its players.
- A real-estate website that tracks a subset of data from consumers’ mobile devices, and makes real-time property recommendations of properties to visit based on their geo-location.
Stream processing is ideal for time-critical operations that require an instant real-time response. For example, a system that monitors a building for smoke and heat needs to trigger alarms and unlock doors to allow residents to escape immediately in the event of a fire.
Understand differences between batch and streaming data
Apart from the way in which batch processing and streaming processing handle data, there are other differences:
Data Scope: Batch data can process all the data in the dataset. Stream processing typically only has access to the most recent data received, or within a rolling time window (the last 30 seconds, for example).
Data Size: Batch data is suitable for handling large datasets efficiently. Stream processing is intended for individual records or micro batches consisting of few records.
Performance: The latency for batch processing is typically a few hours. Stream processing typically occurs immediately, with latency in the order of seconds or milliseconds. Latency is the time taken for the data to be received and processed.
Analysis: You typically use batch processing for performing complex analytics. Stream processing is used for simple response functions, aggregates, or calculations such as rolling averages.
Explore roles and responsibilities in the world of data
Introduction
Over the last decade, the amount of data that systems and devices generate has increased significantly. Because of this increase, new technologies, roles, and approaches to working with data are affecting data professionals. Data professionals typically fulfill different roles when managing, using, and controlling data. In this module, you'll learn about the various roles that organizations often apply to data professionals, and the tasks and responsibilities associated with these roles.
Learning objectives
In this module you will:
- Explore data job roles
- Explore common tasks and tools for data job roles
Explore job roles in the world of data
There's a wide variety of roles involved in managing, controlling, and using data. Some roles are business-oriented, some involve more engineering, some focus on research, and some are hybrid roles that combine different aspects of data management. In this unit, you'll explore the most common job roles in the world of data. Your organization may define roles differently, or give them different names, but the roles described in this unit encapsulate the most common division of labor and responsibilities.
What are the roles in the world of data?
There are three key job roles that deal with data in most organizations. Database Administrators manage databases, assigning permissions to users, storing backup copies of data and restore data in case of any failures. Data Engineers are vital in working with data, applying data cleaning routines, identifying business rules, and turning data into useful information. Data Analysts explore and analyze data to create visualizations and charts to enable organizations to make informed decisions.
Azure Database Administrator role
 An Azure database administrator is responsible for the design, implementation, maintenance, and operational aspects of on-premises and cloud-based database solutions built on Azure data services and SQL Server. They are responsible for the overall availability and consistent performance and optimizations of the database solutions. They work with stakeholders to implement policies, tools, and processes for backup and recovery plans to recover following a natural disaster or human-made error.
The database administrator is also responsible for managing the security of the data in the database, granting privileges over the data, granting or denying access to users as appropriate.
Data Engineer role
 A data engineer collaborates with stakeholders to design and implement data-related assets that include data ingestion pipelines, cleansing and transformation activities, and data stores for analytical workloads. They use a wide range of data platform technologies, including relational and nonrelational databases, file stores, and data streams.
They are also responsible for ensuring that the privacy of data is maintained within the cloud and spanning from on-premises to the cloud data stores. They also own the management and monitoring of data stores and data pipelines to ensure that data loads perform as expected.
Data Analyst role
 A data analyst enables businesses to maximize the value of their data assets. They are responsible for designing and building scalable models, cleaning and transforming data, and enabling advanced analytics capabilities through reports and visualizations.
A data analyst processes raw data into relevant insights based on identified business requirements to deliver relevant insights.
Review tasks and tools for database administration
Database Administrators are tasked with managing and organizing databases. A database administrator's primary job is to ensure that data is available, protected from loss, corruption, or theft, and is easily accessible as needed.
Database Administrator tasks and responsibilities
Some of the most common roles and responsibilities of a database administrator include:
- Installing and upgrading the database server and application tools.
- Allocating system storage and planning storage requirements for the database system.
- Modifying the database structure, as necessary, from information given by application developers.
- Enrolling users and maintaining system security.
- Ensuring compliance with database vendor license agreement.
- Controlling and monitoring user access to the database.
- Monitoring and optimizing the performance of the database.
- Planning for backup and recovery of database information.
- Maintaining archived data.
- Backing up and restoring databases.
- Contacting database vendor for technical support.
- Generating various reports by querying from database as per need.
- Managing and monitoring data replication.
- Acting as liaison with users.
Common database administrator tools
Most database management systems provide their own set of tools to assist with database administration. For example, SQL Server Database Administrators use SQL Server Management Studio for most of their day-to-day database maintenance activities. Other systems have their own database-specific interfaces, such as pgAdmin for PostgreSQL systems, or MySQL Workbench for MySQL. There are also a number of cross-platform database administration tools available. One example is Azure Data Studio.
What is Azure Data Studio?
Azure Data Studio provides a graphical user interface for managing many different database systems. It currently provides connections to on-premises SQL Server databases, Azure SQL Database, PostgreSQL, Azure SQL Data Warehouse, and SQL Server Big Data Clusters, amongst others. It's an extensible tool, and you can download and install extensions from third-party developers that connect to other systems, or provide wizards that help to automate many administrative tasks.

What is SQL Server Management Studio?
SQL Server Management Studio provides a graphical interface, enabling you to query data, perform general database administration tasks, and generate scripts for automating database maintenance and support operations. The example below shows SQL Server Management Studio being used to back up a database.

A useful feature of SQL Server Management Studio is the ability to generate Transact-SQL scripts for almost all of the functionality that SSMS provides. This gives the DBA the ability to schedule and automate many common tasks.

Note
Transact-SQL is a set of programming extensions from Microsoft that adds several features to the Structured Query Language (SQL), including transaction control, exception and error handling, row processing, and declared variables.
Use the Azure portal to manage Azure SQL Database
Azure SQL database provides database services in Azure. It's similar to SQL Server, except that it runs in the cloud. You can manage Azure SQL database using Azure portal.
Typical configuration tasks such as increasing the database size, creating a new database, and deleting an existing database are done using the Azure portal.

You can use the Azure portal to dynamically manage and adjust resources such as the data storage size and the number of cores available for the database processing. These tasks would require the support of a system administrator if you were running the database on-premises.
Review tasks and tools for data engineering
Data engineers are tasked with managing and organizing data, while also monitoring for trends or inconsistencies that will impact business goals. It’s a highly technical position, requiring experience and skills in areas like programming, mathematics, and computer science. But data engineers also need soft skills to communicate data trends to others in the organization and to help the business make use of the data it collects.
Data Engineer tasks and responsibilities
Some of the most common roles and responsibilities of a data engineer include:
- Developing, constructing, testing, and maintaining databases and data structures.
- Aligning the data architecture with business requirements.
- Data acquisition.
- Developing processes for creating and retrieving information from data sets.
- Using programming languages and tools to examine the data.
- Identifying ways to improve data reliability, efficiency, and quality.
- Conducting research for industry and business questions.
- Deploying sophisticated analytics programs, machine learning, and statistical methods.
- Preparing data for predictive and prescriptive modeling.
- Using data to discover tasks that can be automated.
Common data engineering tools
To master data engineering, you'll need to be familiar with a range of tools that enable you to create well-designed databases, optimized for the business processes that will be run. You must have a thorough understanding of the architecture of the database management system, the platform on which the system runs, and the business requirements for the data being stored in the database.
If you're using a relational database management system, you need to be fluent in SQL. You must be able to use SQL to create databases, tables, indexes, views, and the other objects required by the database. Many database management systems provide tools that enable you to create and run SQL scripts. For example, SQL Server Management Studio (described in the previous unit), lets you create and query tables visually, but you can also create your own SQL scripts manually.
In some cases, you may need to interact with a database from the command line. Many database management systems provide a command-line interface that supports these operations. For example, you can use the sqlcmd utility to connect to Microsoft SQL Server and Azure SQL Database, and run ad-hoc queries and commands.
As a SQL Server professional, your primary data manipulation tool might be Transact-SQL. As a data engineer you might use additional technologies, such as Azure Databricks, and Azure HDInsight to generate and test predictive models. If you're working in the non-relational field, you might use Azure Cosmos DB as your primary data store. To manipulate and query the data, you might use languages such as HiveQL, R, or Python.
Review tasks and tools for data visualization and reporting
Data analysts are responsible for understanding what data actually means. A skilled data analyst will explore the data and use it to determine trends, issues, and gain other insights that might be of benefit to the company.
A large part of the data analyst role is concerned with communication and visualization. Data visualization is key to presenting large amounts of information in ways that are universally understandable or easy to interpret and spot patterns, trends, and correlations. These representations include charts, graphs, infographics, and other pictorial diagrams. Data visualization analysts use visualization tools and software to communicate information in these ways, for clients or for their own company. A good data analyst requires experience and skills in reporting tools such as Microsoft Power BI and SQL Server Reporting Services.
Data Analyst tasks and responsibilities
The primary functions of a data analyst usually include the following:
- Making large or complex data more accessible, understandable, and usable.
- Creating charts and graphs, histograms, geographical maps, and other visual models that help to explain the meaning of large volumes of data, and isolate areas of interest.
- Transforming, improving, and integrating data from many sources, depending on the business requirements.
- Combining the data result sets across multiple sources. For example, combining sales data and weather data provides a useful insight into how weather influenced sales of certain products such as ice creams.
- Finding hidden patterns using data.
- Delivering information in a useful and appealing way to users by creating rich graphical dashboards and reports.
Common data visualization tools
Traditionally, many data analysts used Microsoft Office Apps such as Microsoft Excel for creating rich visual reports. Many analysts now use Microsoft Power BI, a powerful visualization platform, to create rich, graphical dashboards and reports over data that can vary dynamically.
Power BI is a collection of software services, apps, and connectors that work together to turn your unrelated sources of data into coherent, visually immersive, and interactive insights. Your data might be held somewhere local such as an Excel spreadsheet, or in a collection of cloud-based and on-premises databases, or some other set of data sources. Power BI lets you easily connect to your data sources, discover what's important in that data, and share your findings with others in the organization.
The image below shows an example of a dashboard created using Power BI. In this example, the analyst is using Power BI to examine retail sales data for items sold across multiple stores and districts. The metrics compare this year's performance to last year's for sales, units, gross margin, and variance, as well as new-store analysis.


Describe concepts of relational data
Introduction
In the early years of databases, every application stored data in its own unique structure. When developers wanted to build applications to use that data, they had to know a lot about the particular data structure to find the data they needed. These data structures were inefficient, hard to maintain, and hard to optimize for delivering good application performance. The relational database model was designed to solve the problem of multiple arbitrary data structures. The relational model provided a standard way of representing and querying data that could be used by any application. From the beginning, developers recognized that the chief strength of the relational database model was in its use of tables, which were an intuitive, efficient, and flexible way to store and access structured information.
The simple yet powerful relational model is used by organizations of all types and sizes for a broad variety of information management needs. Relational databases are used to track inventories, process ecommerce transactions, manage huge amounts of mission-critical customer information, and much more. A relational database is useful for storing any information containing related data elements that must be organized in a rules-based, consistent way.
In this module, you'll learn about the key characteristics of relational data, and explore relational data structures.
Learning objectives
In this module you will:
- Explore the characteristics of relational data
- Define tables, indexes, and views
- Explore relational data workload offerings in Azure
Explore the characteristics of relational data
One of the main benefits of computer databases is that they make it easy to store information so it's quick and easy to find. For example, an ecommerce system might use a database to record information about the products an organization sells, and the details of customers and the orders they've placed. A relational database provides a model for storing the data, and a query capability that enables you to retrieve data quickly.
In this unit, you'll learn more about the characteristics of relational data, and how you can store this information and query it in a relational database.
Understand the characteristics of relational data
In a relational database, you model collections of entities from the real world as tables. An entity is described as a thing about which information needs to be known or held. In the ecommerce example, you might create tables for customers, products, and orders. A table contains rows, and each row represents a single instance of an entity. In the ecommerce scenario, each row in the customers table contains the data for a single customer, each row in the products table defines a single product, and each row in the orders table represents an order made by a customer.
The rows in a table have one or more columns that define the properties of the entity, such as the customer name, or product ID. All rows in the same table have the same columns. Some columns are used to maintain relationships between tables. This is where the relational model gets its name from. In the image below, the Orders table contains both a Customer ID and a Product ID. The Customer ID relates to the Customers table to identify the customer that placed the order, and the Product ID relates to the Products table to indicate what product was purchased.
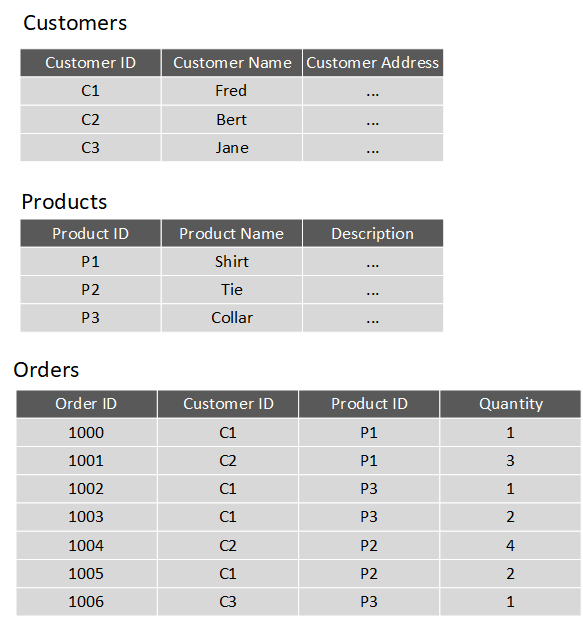
You design a relational database by creating a data model. The model below shows the structure of the entities from the previous example. In this diagram, the columns marked PK are the Primary Key for the table. The primary key indicates the column (or combination of columns) that uniquely identify each row. Every table should have a primary key.
The diagram also shows the relationships between the tables. The lines connecting the tables indicate the type of relationship. In this case, the relationship from customers to orders is 1-to-many (one customer can place many orders, but each order is for a single customer). Similarly, the relationship between orders and products is many-to-1 (several orders might be for the same product).
The columns marked FK are Foreign Key columns. They reference, or link to, the primary key of another table, and are used to maintain the relationships between tables. A foreign key also helps to identify and prevent anomalies, such as orders for customers that don't exist in the Customers table. In the model below, the Customer ID and Product ID columns in the Orders table link to the customer that placed the order and the product that was ordered:
The main characteristics of a relational database are:
All data is tabular. Entities are modeled as tables, each instance of an entity is a row in the table, and each property is defined as a column.
All rows in the same table have the same set of columns.
A table can contain any number of rows.
A primary key uniquely identifies each row in a table. No two rows can share the same primary key.
A foreign key references rows in another, related table. For each value in the foreign key column, there should be a row with the same value in the corresponding primary key column in the other table.
Note
Creating a relational database model for a large organization is a not a trivial task. It can take several iterations to define tables to match the characteristics described above. Sometimes you have to split an entity into more than one table. This process is called normalization.
Most relational databases support Structured Query Language (SQL). You use SQL to create tables, insert, update, and delete rows in tables, and to query data. You use the CREATE TABLE command to create a table, the INSERT statement to store data in a table, the UPDATE statement to modify data in a table, and the DELETE statement to remove rows from a table. The SELECT statement retrieves data from a table. The example query below finds the details of every customer from the sample database shown above.
SELECT CustomerID, CustomerName, CustomerAddress
FROM Customers
Rather than retrieve every row, you can filter data by using a WHERE clause. The next query fetches the order ID and product ID for all orders placed by customer 1.
SELECT OrderID, ProductID
FROM Orders
WHERE CustomerID = 'C1'
You can combine the data from multiple tables in a query using a join operation. A join operation spans the relationships between tables, enabling you to retrieve the data from more than one table at a time. The following query retrieves the name of every customer, together with the product name and quantity for every order they've placed. Notice that each column is qualified with the table it belongs to:
SELECT Customers.CustomerName, Orders.QuantityOrdered, Products.ProductName
FROM Customers JOIN Orders
ON Customers.CustomerID = Orders.CustomerID
JOIN Products
ON Orders.ProductID = Products.ProductID
You can find full details about SQL on the Microsoft website, on the Structured Query Language (SQL) page.
Explore relational database use cases
You can use a relational database any time you can easily model your data as a collection of tables with a fixed set of columns. In theory, you could model almost any dataset in this way, but some scenarios lend themselves to the relational model better than others.
For example, if you have a collection of music, video, or other media files, attempting to force this data into the relational model could be difficult. You may be better off using unstructured storage, such as that available in Azure Blob storage. Similarly, social networking sites use databases to store data about millions of users, each of whom can be linked to any number of other users in a highly complex web of relationships. This type of data lends itself more to a graph database structure rather than a collection of relational tables.
Relational databases are commonly used in ecommerce systems, but one of the major use cases for using relational databases is Online Transaction Processing (OLTP). OLTP applications are focused on transaction-oriented tasks that process a very large number of transactions per minute. Relational databases are well suited for OLTP applications because they naturally support insert, update, and delete operations. A relational database can often be tuned to make these operations fast. Also, the nature of SQL makes it easy for users to perform ad-hoc queries over data.
Examples of OLTP applications that use relational databases are banking solutions, online retail applications, flight reservation systems, and many online purchasing applications.
Explore relational data structures
A relational database comprises a set of tables. A table can have zero (if the table is empty) or more rows. Each table has a fixed set of columns. You can define relationships between tables using primary and foreign keys, and you can access the data in tables using SQL.
Apart from tables, a typical relational database contains other structures that help to optimize data organization, and improve the speed of access. In this unit, you'll look at two of these structures in more detail: indexes and views.
What is an index?
An index helps you search for data in a table. Think of an index over a table like an index at the back of a book. A book index contains a sorted set of references, with the pages on which each reference occurs. When you want to find a reference to an item in the book, you look it up through the index. You can use the page numbers in the index to go directly to the correct pages in the book. Without an index, you might have to read through the entire book to find the references you're looking for.
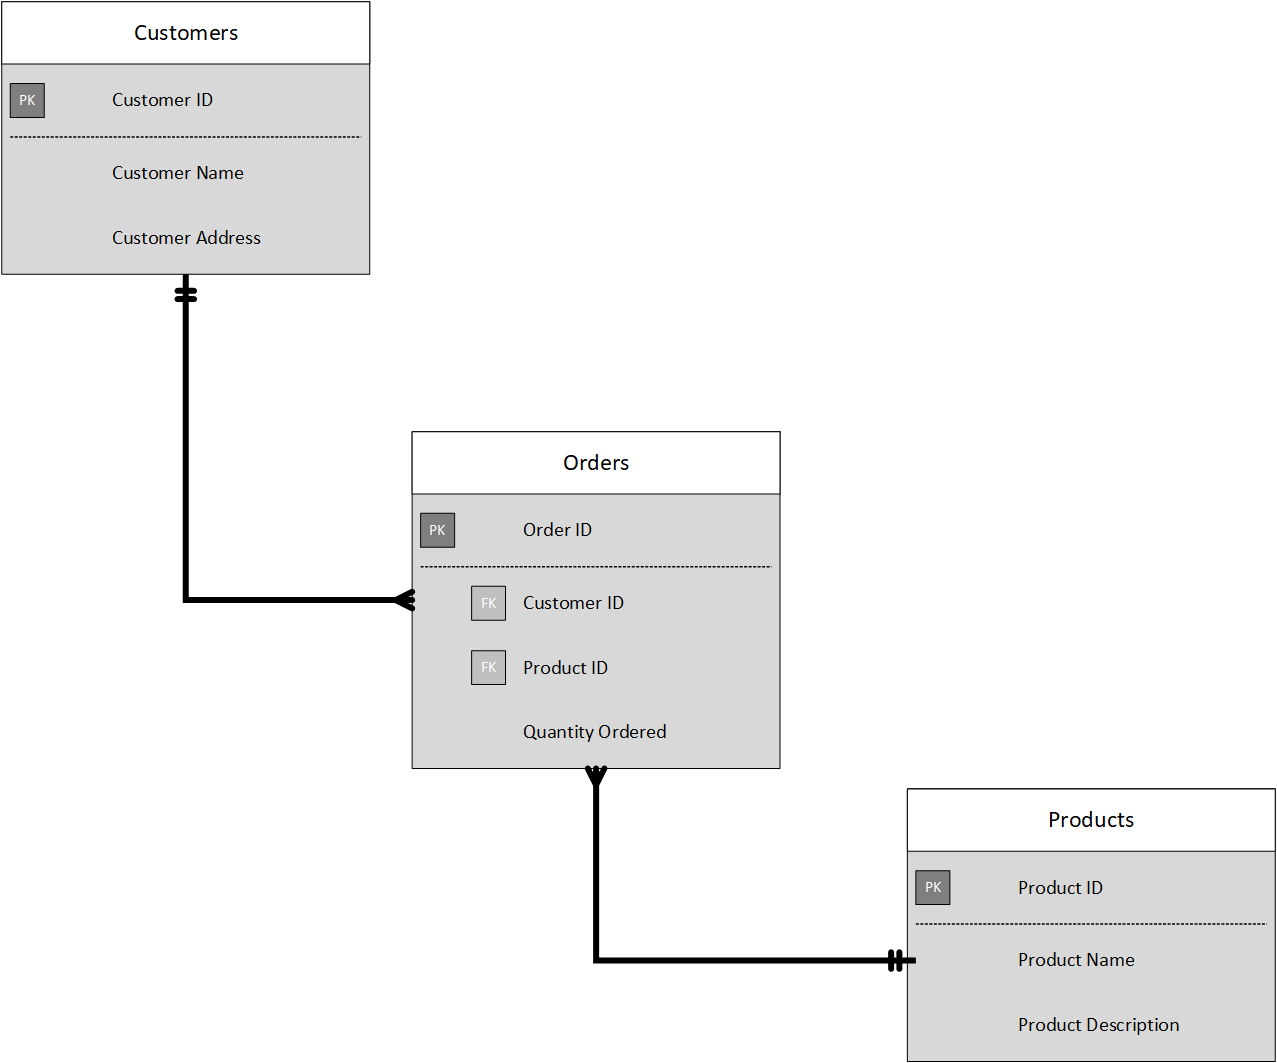
When you create an index in a database, you specify a column from the table, and the index contains a copy of this data in a sorted order, with pointers to the corresponding rows in the table. When the user runs a query that specifies this column in the WHERE clause, the database management system can use this index to fetch the data more quickly than if it had to scan through the entire table row by row. In the example below, the query retrieves all orders for customer C1. The Orders table has an index on the Customer ID column. The database management system can consult the index to quickly find all matching rows in the Orders table.
You can create many indexes on a table. So, if you also wanted to find all orders for a specific product, then creating another index on the Product ID column in the Orders table, would be useful. However, indexes aren't free. An index might consume additional storage space, and each time you insert, update, or delete data in a table, the indexes for that table must be maintained. This additional work can slow down insert, update, and delete operations, and incur additional processing charges. Therefore, when deciding which indexes to create, you must strike a balance between having indexes that speed up your queries versus the cost of performing other operations. In a table that is read only, or that contains data that is modified infrequently, more indexes will improve query performance. If a table is queried infrequently, but subject to a large number of inserts, updates, and deletes (such as a table involved in OLTP), then creating indexes on that table can slow your system down.
Some relational database management systems also support clustered indexes. A clustered index physically reorganizes a table by the index key. This arrangement can improve the performance of queries still further, because the relational database management system doesn't have to follow references from the index to find the corresponding data in the underlying table. The image below shows the Orders table with a clustered index on the Customer ID column.

In database management systems that support them, a table can only have a single clustered index.
What is a view?
A view is a virtual table based on the result set of a query. In the simplest case, you can think of a view as a window on specified rows in an underlying table. For example, you could create a view on the Orders table that lists the orders for a specific product (in this case, product P1) like this:
CREATE VIEW P1Orders AS
SELECT CustomerID, OrderID, Quantity
FROM Orders
WHERE ProductID = "P1"
You can query the view and filter the data in much the same way as a table. The following query finds the orders for customer C1 using the view. This query will only return orders for product P1 made by the customer:
SELECT CustomerID, OrderID, Quantity
FROM P1Orders
WHERE CustomerID = "C1"
A view can also join tables together. If you regularly needed to find the details of customers and the products that they've ordered, you could create a view based on the join query shown in the previous unit:
CREATE VIEW CustomersProducts AS
SELECT Customers.CustomerName, Orders.QuantityOrdered, Products.ProductName
FROM Customers JOIN Orders
ON Customers.CustomerID = Orders.CustomerID
JOIN Products
ON Orders.ProductID = Products.ProductID
The following query finds the customer name and product names of all orders placed by customer C2, using this view:
SELECT CustomerName, ProductName
FROM CustomersProducts
WHERE CustomerID = "C2"
Choose the right platform for a relational workload
Cloud computing has grown in popularity, promising flexibility for enterprises, opportunities for saving time and money, and improving agility and scalability. On the other hand, on-premises software, installed on a company’s own servers and behind its firewall, still has its appeal. On-premises applications are reliable, secure, and allow enterprises to maintain close control.
Relational database management systems are one example of where the cloud has enabled organizations to take advantage of improved scalability. However, this scalability has to be balanced against the need for close control over the data. Data is arguably one of the most valuable assets that an organization has, and some companies aren't willing or able to hand over responsibility for protecting this data to a third party.
In this unit, you'll look at some of the advantages and disadvantages of running a database management system in the cloud.
Compare on-premises hosting to the cloud
Whether a company places its relational workload in the cloud or whether it decides to keep it on premises, data security will always be paramount. But for those businesses in highly regulated industries, the decision might already be made for them as to whether to host their applications on-premises. Knowing that your data is located within your in-house servers and IT infrastructure might also provide more peace of mind.
Hosting a relational database on-premises requires that an enterprise not only purchases the database software, but also maintains the necessary hardware on which to run the database. The organization is responsible for maintaining the hardware and software, applying patches, backing up databases, restoring them when necessary, and generally performing all the day-to-day management required to keep the platform operational. Scalability is also a concern. If you need to scale your system, you will need to upgrade or add more servers. You then need to expand your database onto these servers. This can be a formidable task that requires you to take a database offline while the operation is performed. In the cloud, many of these operations can be handled for you by the data center staff, in many cases with no (or minimal) downtime. You're free to focus on the data itself and leave the management concerns to others (this is what you pay your Azure fees for, after all).
A cloud-based approach uses virtual technology to host a company’s applications offsite. There are no capital expenses, data can be backed up regularly, and companies only have to pay for the resources they use. For those organizations that plan aggressive expansion on a global basis, the cloud has even greater appeal because it allows you to connect with customers, partners, and other businesses anywhere with minimal effort. Additionally, cloud computing gives you nearly instant provisioning because everything is already configured. Thus, any new software that is integrated into your environment is ready to use immediately once a company has subscribed. With instant provisioning, any time spent on installation and configuration is eliminated and users can access the application right away.
Understand IaaS and PaaS
You generally have two options when moving your operations and databases to the cloud. You can select an IaaS approach, or PaaS.
IaaS is an acronym for Infrastructure-as-a-Service. Azure enables you to create a virtual infrastructure in the cloud that mirrors the way an on-premises data center might work. You can create a set of virtual machines, connect them together using a virtual network, and add a range of virtual devices. In many ways, this approach is similar to the way in which you run your systems inside an organization, except that you don't have to concern yourself with buying or maintaining the hardware. However, you're still responsible for many of the day-to-day operations, such as installing and configuring the software, patching, taking backups, and restoring data when needed. You can think of IaaS as a half-way-house to fully managed operations in the cloud; you don't have to worry about the hardware, but running and managing the software is still very much your responsibility.
You can run any software for which you have the appropriate licenses using this approach. You're not restricted to any specific database management system.
The IaaS approach is best for migrations and applications requiring operating system-level access. SQL virtual machines are lift-and-shift. That is, you can copy your on-premises solution directly to a virtual machine in the cloud. The system should work more or less exactly as before in its new location, except for some small configuration changes (changes in network addresses, for example) to take account of the change in environment.
PaaS stands for Platform-as-a-service. Rather than creating a virtual infrastructure, and installing and managing the database software yourself, a PaaS solution does this for you. You specify the resources that you require (based on how large you think your databases will be, the number of users, and the performance you require), and Azure automatically creates the necessary virtual machines, networks, and other devices for you. You can usually scale up or down (increase or decrease the size and number of resources) quickly, as the volume of data and the amount of work being done varies; Azure handles this scaling for you, and you don't have to manually add or remove virtual machines, or perform any other form of configuration.
Azure offers several PaaS solutions for relational databases, include Azure SQL Database, Azure Database for PostgreSQL, Azure Database for MySQL, and Azure Database for MariaDB. These services run managed versions of the database management systems on your behalf. You just connect to them, create your databases, and upload your data. However, you may find that there are some functional restrictions in place, and not every feature of your selected database management system may be available. These restrictions are often due to security issues. For example, they might expose the underlying operating system and hardware to your applications. In these cases, you may need to rework your applications to remove any dependencies on these features.
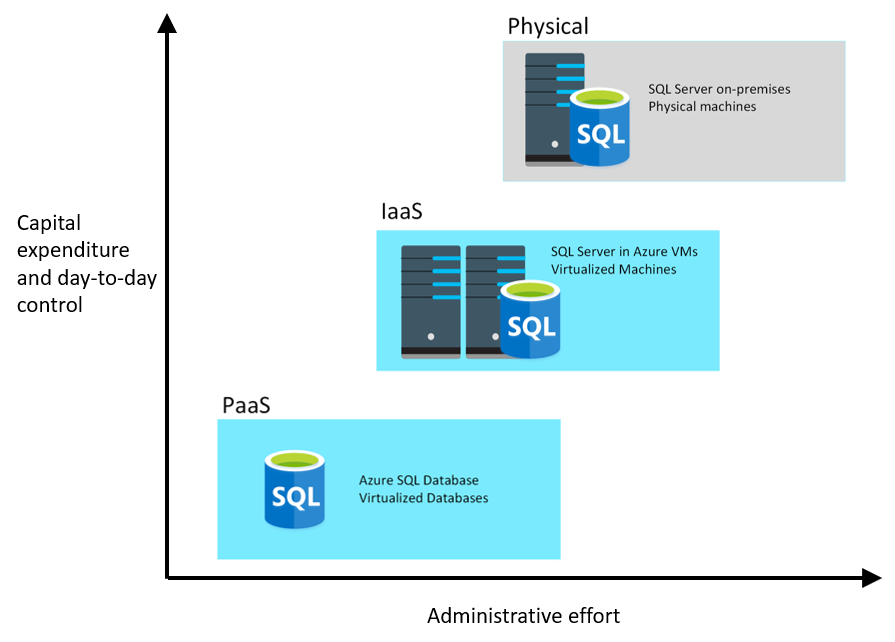
The image below illustrates the benefits and tradeoffs when running a database management system (in this case, SQL Server) on-premises, using virtual machines in Azure (IaaS), or using Azure SQL Database (PaaS). The same generalized considerations are true for other database management systems.

Explore concepts of non-relational data
Introduction
Data comes in all shapes and sizes, and can be used for many purposes. Many organizations use relational databases to store this data. However, the relational model might not be the most appropriate schema. The structure of the data might be too varied to easily model as a set of relational tables. For example, the data might contain items such as video, audio, images, temporal information, large volumes of free text, or other types of data that aren't inherently relational. Additionally, the data processing requirements might not be best suited by attempting to convert this data into the relational format. In these situations, it may be better to use non-relational repositories that can store data in its original format, but that allow fast storage and retrieval access to this data.
Suppose you're a data engineer working at Contoso, an organization with a large manufacturing operation. The organization has to gather and store information from a range of sources, such as real-time data monitoring the status of production line machinery, product quality control data, historical production logs, product volumes in stock, and raw materials inventory data. This information is critical to the operation of the organization. You've been asked to determine how best to store this information, so that it can be stored quickly, and queried easily.
Learning objectives
In this module, you will:
- Explore the characteristics of non-relational data
- Define types of non-relational data
- Describe NoSQL, and the types of non-relational databases
Explore characteristics of non-relational data
Relational databases are an excellent tool for storing and retrieving data that has a well-known structure, containing fields that you can define in advance. In some situations, you might not have the required knowledge of the structure of your data, in advance of it arriving in your database, to record it as a neat set of rows and columns in a tabular format. This is a common scenario in systems that consume data from a wide variety of sources, such as data ingestion pipelines. In these situations, a non-relational database can prove extremely useful.
In this unit, you'll look in more detail at the common characteristics of non-relational databases. You'll learn how they enable you to capture data quickly, and model data that can vary in structure.
What are the characteristics of non-relational data?
You use a database to model some aspect of the real-world. Entities in the real-world often have highly variable structures. For example, in an ecommerce database that stores information about customers, how many telephone numbers does a customer have? A customer might have a landline and a mobile number, but some customers might have a business number, an additional home number, and maybe several mobile numbers. Similarly, the addresses of customers might not always follow the same format; addresses for customers in different states and regions might contain different elements, such as zip codes or postal codes.
In another scenario, if you are ingesting data rapidly, you want to capture the data and save it very quickly. Processing the data and manipulating it into a set of rows in different tables in a relational database might not be appropriate at this point; you can perform these tasks as part at a later date. At the time of ingestion, you simply need to store the data in its original state and format.
A key aspect of non-relational databases is that they enable you to store data in a very flexible manner. Non-relational databases don't impose a schema on data. Instead, they focus on the data itself rather than how to structure it. This approach means that you can store information in a natural format, that mirrors the way in which you would consume, query and use it.
In a non-relational system, you store the information for entities in collections or containers rather than relational tables. Two entities in the same collection can have a different set of fields rather than a regular set of columns found in a relational table. The lack of a fixed schema means that each entity must be self-describing. Often this is achieved by labeling each field with the name of the data that it represents. For example, a non-relational collection of customer entities might look like this:
## Customer 1
ID: 1
Name: Mark Hanson
Telephone: [ Home: 1-999-9999999, Business: 1-888-8888888, Cell: 1-777-7777777 ]
Address: [ Home: 121 Main Street, Some City, NY, 10110,
Business: 87 Big Building, Some City, NY, 10111 ]
## Customer 2
ID: 2
Title: Mr
Name: Jeff Hay
Telephone: [ Home: 0044-1999-333333, Mobile: 0044-17545-444444 ]
Address: [ UK: 86 High Street, Some Town, A County, GL8888, UK,
US: 777 7th Street, Another City, CA, 90111 ]
In this example, fields are prefixed with a name. Fields might also have multiple subfields, also with names. In the example, multiple subfields are denoted by enclosing them between square brackets.
Adding a new customer is a matter of inserting an entity with its fields labeled in a meaningful way. An application that queries this data must be prepared to parse the information in the entity that it retrieves.
The data retrieval capabilities of a non-relational database can vary. Each entity should have a unique key value. The entities in a collection are usually stored in key-value order. In the example above, the unique key is the ID field. The simplest type of non-relational database enables an application to either specify the unique key, or a range of keys as query criteria. In the customers example, the database would enable an application to query customers by ID only. Filtering data on other fields would require scanning the entire collection of entities, parsing each entity in turn, and then applying any query criteria to each entity to find any matches. In the example below, a query that fetches the details of a customer by ID can quickly identify which entity to retrieve. A query that attempts to find all customers with a UK address would have to iterate through every entity, and for each entity examine each field in turn. If the database contains many millions of entities, this query could take a considerable time to run.

More advanced non-relational systems support indexing, in a similar manner to an index in a relational database. Queries can then use the index to identify and fetch data based on non-key fields. Non-relational systems such as Azure Cosmos DB (a non-relational database management system available in Azure), support indexing even when the structure of the indexed data can vary from record to record. For more information, read Indexing in Azure Cosmos DB - Overview.
When you design a non-relational database, it's important to understand the capabilities of the database management system and the types of query it will have to support.
Note
Non-relational databases often provide their own proprietary language for managing and querying data. This language may be procedural, or it may be similar to SQL; it depends on how the database is implemented by the database management system.
Identify non-relational database use cases
Non-relational databases are highly suitable for the following scenarios:
IoT and telematics. These systems typically ingest large amounts of data in frequent bursts of activity. Non-relational databases can store this information very quickly. The data can then be used by analytics services such as Azure Machine Learning, Azure HDInsight, and Microsoft Power BI. Additionally, you can process the data in real-time using Azure Functions that are triggered as data arrives in the database.
Retail and marketing. Microsoft uses CosmosDB for its own ecommerce platforms that run as part of Windows Store and Xbox Live. It's also used in the retail industry for storing catalog data and for event sourcing in order processing pipelines.
Gaming. The database tier is a crucial component of gaming applications. Modern games perform graphical processing on mobile/console clients, but rely on the cloud to deliver customized and personalized content like in-game stats, social media integration, and high-score leaderboards. Games often require single-millisecond latencies for reads and write to provide an engaging in-game experience. A game database needs to be fast and be able to handle massive spikes in request rates during new game launches and feature updates.
Web and mobile applications. A non-relational database such as Azure Cosmos DB is commonly used within web and mobile applications, and is well suited for modeling social interactions, integrating with third-party services, and for building rich personalized experiences. The Cosmos DB SDKs (software development kits) can be used to build rich iOS and Android applications using the popular Xamarin framework.
Describe types of non-relational data
Non-relational data generally falls into two categories; semi-structured and non-structured. In this unit, you'll learn about what these terms mean, and see some examples.
What is semi-structured data?
Semi-structured data is data that contains fields. The fields don't have to be the same in every entity. You only define the fields that you need on a per-entity basis. The Customer entities shown in the previous unit are examples of semi-structured data. The data must be formatted in such a way that an application can parse and process it. One common way of doing this is to store the data for each entity as a JSON document. The term JSON stands for JavaScript Object Notation; it's the format used by JavaScript applications to store data in memory, but can also be used to read and write documents to and from files.
A JSON document is enclosed in curly brackets ({ and }). Each field has a name (a label), followed by a colon, and then the value of the field. Fields can contain simple values, or subdocuments (each starting and ending with curly brackets). Fields can also have multiple values, held as arrays and surrounded with square brackets ([ and ]). Literals in a field are enclosed in quotes, and fields are separated with commas.
The example below shows the customers from the previous unit, formatted as JSON documents:
{
  "ID": "1",
  "Name": "Mark Hanson",
  "Telephone": [
    { "Home": "1-999-9999999" },
    { "Business": "1-888-8888888" },
    { "Cell": "1-777-7777777" }
  ],
  "Address": [
    { "Home": [
      { "StreetAddress": "121 Main Street" },
      { "City": "Some City" },
      { "State": "NY" },
      { "Zip": "10110" }
    ] },
    { "Business": [
      { "StreetAddress": "87 Big Building" },
      { "City": "Some City" },
      { "State": "NY" },
      { "Zip": "10111" }
    ] }
  ]
}


{
  "ID": "2",
  "Title": "Mr",
  "Name": "Jeff Hay",
  "Telephone": [
    { "Home": "0044-1999-333333" },
    { "Mobile": "0044-17545-444444" }
  ],
  "Address": [
    { "UK": [
      { "StreetAddress": "86 High Street" },
      { "Town": "Some Town" },
      { "County": "A County" },
      { "Postcode": "GL8888" },
      { "Region": "UK" }
    ] },
    { "US": [
      { "StreetAddress": "777 7th Street" },
      { "City": "Another City" },
      { "State": "CA" },
      { "Zip": "90111" }
    ] }
  ]
}
You're free to define whatever fields you like. The important point is that the data follows the JSON grammar. When an application reads a document, it can use a JSON parser to break up the document into its component fields and extract the individual pieces of data.
Other formats you might see include Avro, ORC, and Parquet:
Avro is a row-based format. It was created by Apache. Each record contains a header that describes the structure of the data in the record. This header is stored as JSON. The data is stored as binary information. An application uses the information in the header to parse the binary data and extract the fields it contains. Avro is a very good format for compressing data and minimizing storage and network bandwidth requirements.
ORC (Optimized Row Columnar format) organizes data into columns rather than rows. It was developed by HortonWorks for optimizing read and write operations in Apache Hive. Hive is a data warehouse system that supports fast data summarization and querying over very large datasets. Hive supports SQL-like queries over unstructured data. An ORC file contains stripes of data. Each stripe holds the data for a column or set of columns. A stripe contains an index into the rows in the stripe, the data for each row, and a footer that holds statistical information (count, sum, max, min, and so on) for each column.
Parquet is another columnar data format. It was created by Cloudera and Twitter. A Parquet file contains row groups. Data for each column is stored together in the same row group. Each row group contains one or more chunks of data. A Parquet file includes metadata that describes the set of rows found in each chunk. An application can use this metadata to quickly locate the correct chunk for a given set of rows, and retrieve the data in the specified columns for these rows. Parquet specializes in storing and processing nested data types efficiently. It supports very efficient compression and encoding schemes.
What is unstructured data?
Unstructured data is data that doesn't naturally contain fields. Examples include video, audio, and other media streams. Each item is an amorphous blob of binary data. You can't search for specific elements in this data.
You might choose to store data such as this in storage that is specifically designed for the purpose. In Azure, you would probably store video and audio data as block blobs in an Azure Storage account. (The term blob stands for Binary Large OBject*). A block blob only supports basic read and write operations, and has no internal search capability.
You could also consider files as a form of unstructured data, although in some cases a file might include metadata that indicates what type of file it is (photograph, Word document, Excel spreadsheet, and so on), owner, and other elements that could be stored as fields. However, the main content of the file is unstructured.
Describe types of non-relational and NoSQL databases
Non-relational data is an all-encompassing term that means anything not structured as a set of tables. There are many different types of non-structured data, and the information is used for a wide variety of purposes. Consequently, there are many different types of non-relational database management systems, each oriented towards a specific set of scenarios.
In this unit, you'll learn about some of the most common types of non-relational databases.
What is NoSQL?
You might see the term NoSQL when reading about non-relational databases. NoSQL is a rather loose term that simply means non-relational. There's some debate about whether it's intended to imply Not SQL, or Not Only SQL; some non-relational databases support a version of SQL adapted for documents rather than tables (examples include Azure Cosmos DB).
NoSQL (non-relational) databases generally fall into four categories: key-value stores, document databases, column family databases, and graph databases. The following sections discuss these types of NoSQL databases.
What is a key-value store?
A key-value store is the simplest (and often quickest) type of NoSQL database for inserting and querying data. Each data item in a key-value store has two elements, a key and a value. The key uniquely identifies the item, and the value holds the data for the item. The value is opaque to the database management system. Items are stored in key order.
Note
The term opaque means that the database management system just sees the value as an unstructured block. Only the application understands how the data in the value is structured and what fields it contains. The opposite of opaque is transparent. If the data is transparent, the database management system understands how the fields in the data are organized. A relational table is an example of a transparent structure.

A query specifies the keys to identify the items to be retrieved. You can't search on values. An application that retrieves data from a key-value store is responsible for parsing the contents of the values returned.
Write operations are restricted to inserts and deletes. If you need to update an item, you must retrieve the item, modify it in memory (in the application), and then write it back to the database, overwriting the original (effectively a delete and an insert).
The focus of a key-value store is the ability to read and write data very quickly. Search capabilities are secondary. A key-value store is an excellent choice for data ingestion, when a large volume of data arrives as a continual stream and must be stored immediately.
Azure Table storage is an example of a key-value store. Cosmos DB also implements a key-value store using the Table API.
What is a document database?
A document database represents the opposite end of the NoSQL spectrum from a key-value store. In a document database, each document has a unique ID, but the fields in the documents are transparent to the database management system. Document databases typically store data in JSON format, as described in the previous unit, or they could be encoded using other formats such XML, YAML, JSON, BSON. Documents could even be stored as plain text. The fields in documents are exposed to the storage management system, enabling an application to query and filter data by using the values in these fields.
Typically, a document contains the entire data for an entity. What items constitute an entity are application-specific. For example, an entity could contain the details of a customer, an order, or a combination of both. A single document may contain information that would be spread across several relational tables in an RDBMS (relational database management system).
A document store does not require that all documents have the same structure. This free-form approach provides a great deal of flexibility. Applications can store different data in documents as business requirements change.

An application can retrieve documents by using the document key. The key is a unique identifier for the document. Some document databases create the document key automatically. Others enable you to specify an attribute of the document to use as the key. The application can also query documents based on the value of one or more fields. Some document databases support indexing to facilitate fast lookup of documents based on one or more indexed fields.
Some document database management systems support in-place updates, enabling an application to modify the values of specific fields in a document without rewriting the entire document. Other document database management systems (such as Cosmos DB) can only read and write entire documents. In these cases, an update replaces the entire document with a new version. This approach helps to reduce fragmentation in the database, which can, in turn, improve performance.
Most document databases will ingest large volumes of data more rapidly than a relational database, but aren't as optimal as a key-value store for this type of processing. The focus of a document database is its query capabilities.
Azure Cosmos DB implements a document database approach in its Core (SQL) API.
What is a column family database?
A column family database organizes data into rows and columns. Examples of this structure include ORC and Parquet files, described in the previous unit.
In its simplest form, a column family database can appear very similar to a relational database, at least conceptually. The real power of a column family database lies in its denormalized approach to structuring sparse data.
For example, if you need to store information about customers and their addresses in a relational database (ignoring the need to maintain historical data as described in the previous section), you might design a schema similar to that shown below. This diagram also shows some sample data. In this example, customer 1 and customer 3 share the same address, and the schema ensures that this address information is not duplicated. This is a standard way of implementing a one-to-many relationship.

The relational model supports a very generalized approach to implementing this type of relationship, but to find the address of any given customer an application needs to run a query that joins two tables. If this is the most common query performed by the application, then the overhead associated with performing this join operation can quickly become significant if there are a large number of requests and the tables themselves are large.
The purpose of a column family database is to efficiently handle situations such as this. You can think of a column family database as holding tabular data comprising rows and columns, but you can divide the columns into groups known as column-families. Each column family holds a set of columns that are logically related together. The image below shows one way of structuring the same information as the previous image, by using a column family database to group the data into two column-families holding the customer name and address information. Other ways of organizing the columns are possible, but you should implement your column-families to optimize the most common queries that your application performs. In this case, queries that retrieve the addresses of customers can fetch the data with fewer reads than would be required in the corresponding relational database; these queries can fetch the data directly from the AddressInfo column family.

The illustration above is conceptual rather than physical, and is intended to show the logical structure of the data rather than how it might be physically organized. Each row in a column family database contains a key, and you can fetch the data for a row by using this key.
In most column family databases, the column-families are stored separately. In the previous example, the CustomerInfo column family might be held in one area of physical storage and the AddressInfo column family in another, in a simple form of vertical partitioning. You should really think of the structure in terms of column-families rather than rows. The data for a single entity that spans multiple column-families will have the same row key in each column family. As an alternative to the conceptual layout shown previously, you can visualize the data shown as the following pair of physical structures.

The most widely used column family database management system is Apache Cassandra. Azure Cosmos DB supports the column-familiy approach through the Cassandra API.
What is a graph database?
Graph databases enable you to store entities, but the main focus is on the relationships that these entities have with each other. A graph database stores two types of information: nodes that you can think of as instances of entities, and edges, which specify the relationships between nodes. Nodes and edges can both have properties that provide information about that node or edge (like columns in a table). Additionally, edges can have a direction indicating the nature of the relationship.
The purpose of a graph database is to enable an application to efficiently perform queries that traverse the network of nodes and edges, and to analyze the relationships between entities. The image below shows an organization's personnel database structured as a graph. The entities are the employees and the departments in the organization, and the edges indicate reporting lines and the department in which employees work. In this graph, the arrows on the edges show the direction of the relationships.

A structure such as this makes it straightforward to conduct inquiries such as "Find all employees who directly or indirectly work for Sarah" or "Who works in the same department as John?" For large graphs with lots of entities and relationships, you can perform very complex analyses very quickly, and many graph databases provide a query language that you can use to traverse a network of relationships efficiently. You can often store the same information in a relational database, but the SQL required to query this information might require many expensive recursive join operations and nested subqueries.
Azure Cosmos DB supports graph databases using the Gremlin API. The Gremlin API is a standard language for creating and querying graphs.

Explore concepts of data analytics
Introduction
Successful companies make informed decisions to find new opportunities, identify weaknesses, increase efficiency, and improve customer satisfaction. Data analytics is the process of examining raw data to uncover trends, and discover information used to ask and answer questions related to organizational performance.
For example, resorts and casinos might combine data from previous customer visits to determine the best time to run specific activities and games. A data analyst might take data such as customer spend and look for correlations with other factors such as the weather, regional events, or even the presence (or absence) of incentives such as food and drink.
Another example is the healthcare industry. There's an abundance of data in the healthcare industry, including patient records and insurance information. Because there's so much data, it can be difficult to manage. Data analytics allows for a thorough look at the data and can lead to a faster diagnosis or treatment plan.
In this module, you'll explore the key elements involved in data analysis. You'll look at collecting data, processing data to generate information, and visualizing results to spot trends.
Learning objectives
In this module you will:
- Learn about data ingestion and processing
- Explore data visualization
- Explore data analytics
Describe data ingestion and processing
Data analytics is concerned with taking the data that your organization produces, and using it to establish a picture of how your organization is performing, and what you can do to maintain business performance. Data analytics helps you to identify strengths and weaknesses in your organization, and enables you to make appropriate business decisions.
The data a company uses can come from many sources. There could be a mass of historical data to comb through, and fresh data continuing to arrive all the time. This data could be the result of customer purchases, bank transactions, stock price movements, real-time weather data, monitoring devices, or even cameras. In a data analytics solution, you combine this data and construct a data warehouse that you can use to ask (and answer) questions about your business operations. Building a data warehouse requires that you can capture the data that you need and wrangle it into an appropriate format. You can then use analysis tools and visualizations to examine the information, and identity trends and their causes.
Note
Wrangling is the process by which you transform and map raw data into a more useful format for analysis. It can involve writing code to capture, filter, clean, combine, and aggregate data from many sources.
In this unit, you'll learn about two important stages in data analytics: data ingestion, and data processing. The diagram below shows how these stages fit together.

What is data ingestion?
Data ingestion is the process of obtaining and importing data for immediate use or storage in a database. The data can arrive as a continuous stream, or it may come in batches, depending on the source. The purpose of the ingestion process is to capture this data and store it. This raw data can be held in a repository such as a database management system, a set of files, or some other type of fast, easily accessible storage.
The ingestion process might also perform filtering. For example, ingestion might reject suspicious, corrupt, or duplicated data. Suspicious data might be data arriving from an unexpected source. Corrupt or duplicated data could be due to a device error, transmission failure, or tampering.
It may also be possible to perform some transformations at this stage, converting data into a standard form for later processing. For example, you might want to reformat all date and time data to use the same date and time representations, and convert all measurement data to use the same units. However, these transformations must be quick to perform. Don't attempt to run any complex calculations or aggregations on the data at this stage.
What is data processing?
The data processing stage occurs after the data has been ingested and collected. Data processing takes the data in its raw form, cleans it, and converts it into a more meaningful format (tables, graphs, documents, and so on). The result is a database of data that you can use to perform queries and generate visualizations, giving it the form and context necessary to be interpreted by computers and used by employees throughout an organization.
Note
Data cleaning is a generalized term that encompasses a range of actions, such as removing anomalies, and applying filters and transformations that would be too time-consuming to run during the ingestion stage.
The aim of data processing is to convert the raw data into one or more business models. A business model describes the data in terms of meaningful business entities, and may aggregate items together and summarize information. The data processing stage could also generate predictive or other analytical models from the data. Data processing can be complex, and may involve automated scripts, and tools such as Azure Databricks, Azure Functions, and Azure Cognitive Services to examine and reformat the data, and generate models. A data analyst could use machine learning to help determine future trends based on these models.

What is ELT and ETL?
The data processing mechanism can take two approaches to retrieving the ingested data, processing this data to transform it and generate models, and then saving the transformed data and models. These approaches are known as ETL and ELT.
ETL stands for Extract, Transform, and Load. The raw data is retrieved and transformed before being saved. The extract, transform, and load steps can be performed as a continuous pipeline of operations. It is suitable for systems that only require simple models, with little dependency between items. For example, this type of process is often used for basic data cleaning tasks, deduplicating data, and reformatting the contents of individual fields.

An alternative approach is ELT. ELT is an abbreviation of Extract, Load, and Transform. The process differs from ETL in that the data is stored before being transformed. The data processing engine can take an iterative approach, retrieving and processing the data from storage, before writing the transformed data and models back to storage. ELT is more suitable for constructing complex models that depend on multiple items in the database, often using periodic batch processing.

ELT is a scalable approach that is suitable for the cloud because it can make use of the extensive processing power available. The more stream-oriented approach of ETL places more emphasis on throughput. However, ETL can filter data before it's stored. In this way, ETL can help with data privacy and compliance, removing sensitive data before it arrives in your analytical data models.
Azure provides several options that you can use to implement the ELT and ETL approaches. For example, if you are storing data in Azure SQL Database, you can use SQL Server Integration Services. Integration Services can extract and transform data from a wide variety of sources such as XML data files, flat files, and relational data sources, and then load the data into one or more destinations.
Another more generalized approach is to use Azure Data Factory. Azure Data Factory is a cloud-based data integration service that allows you to create data-driven workflows for orchestrating data movement and transforming data at scale. Using Azure Data Factory, you can create and schedule data-driven workflows (called pipelines) that can ingest data from disparate data stores. You can build complex ETL processes that transform data visually with data flows, or by using compute services such as Azure HDInsight Hadoop, Azure Databricks, and Azure SQL Database.
Explore data visualization
A business model can contain an enormous amount of information. The purpose of producing a model such as this is to help you reason over the information it contains, ask questions, and hopefully obtain answers that can help you drive your business forward.
This unit discusses some of the techniques you can use to analyze and understand the information in your models.
What is reporting?
Reporting is the process of organizing data into informational summaries to monitor how different areas of an organization are performing. Reporting helps companies monitor their online business, and know when data falls outside of expected ranges. Good reporting should raise questions about the business from its end users. Reporting shows you what has happened, while analysis focuses on explaining why it happened and what you can do about it.
What is business intelligence?
The term Business Intelligence (BI) refers to technologies, applications, and practices for the collection, integration, analysis, and presentation of business information. The purpose of business intelligence is to support better decision making.
Business intelligence systems provide historical, current, and predictive views of business operations, most often using data that has been gathered into a data warehouse, and occasionally working from live operational data. Software elements support reporting, interactive “slice-and-dice” pivot table analysis, visualization, and statistical data mining. Applications tackle sales, production, financial, and many other sources of business data for purposes that include business performance management. Information is often gathered about other companies in the same industry for comparison. This process is known as benchmarking.
What is data visualization?
Data visualization is the graphical representation of information and data. By using visual elements like charts, graphs, and maps, data visualization tools provide an accessible way to spot and understand trends, outliers, and patterns in data. If you are using Azure, the most popular data visualization tool is Power BI.
Using Power BI, you can connect to multiple different sources of data, and combine them into a data model. This data model lets you build visuals, and collections of visuals you can share as reports, with other people inside your organization.
Explore visualization options to represent data
Data visualization helps you to focus on the meaning of data, rather than looking at the data itself. A good data visualization enables you to quickly spot trends, anomalies, and potential issues. The most common forms of visualizations are:
Bar and column charts: Bar and column charts enable you to see how a set of variables changes across different categories. For example, the first chart below shows how sales for a pair of fictitious retailers vary between store sites.
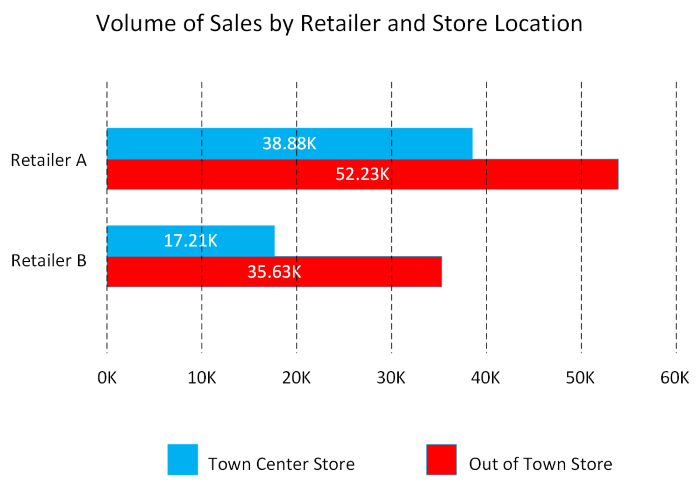
This chart shows how sales vary by month.
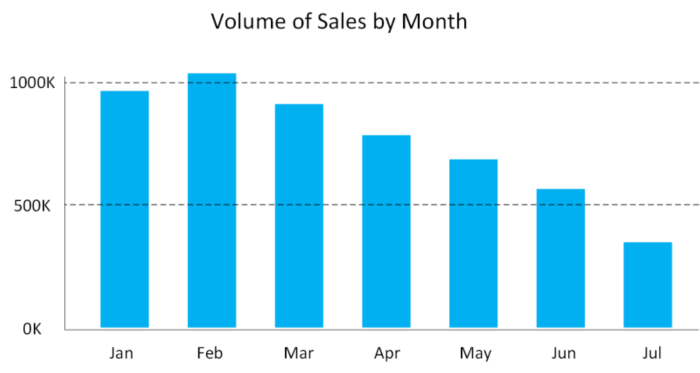
Line charts: Line charts emphasize the overall shape of an entire series of values, usually over time.
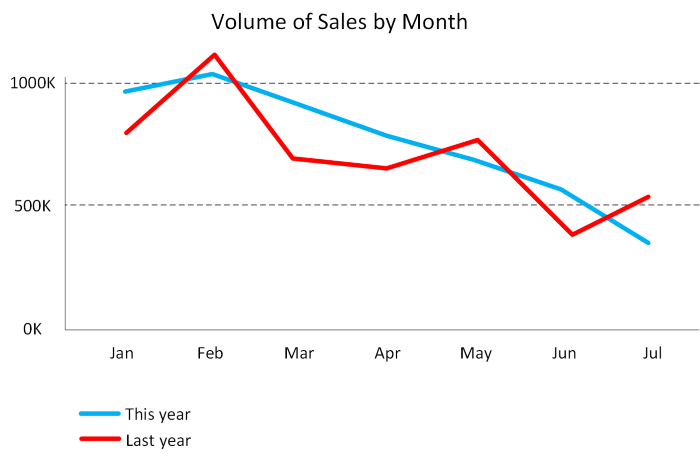
Matrix: A matrix visual is a tabular structure that summarizes data. Often, report designers include matrixes in reports and dashboards to allow users to select one or more element (rows, columns, cells) in the matrix to cross-highlight other visuals on a report page.

Key influencers: A key influencer chart displays the major contributors to a selected result or value. Key influencers are a great choice to help you understand the factors that influence a key metric. For example, what influences customers to place a second order or why sales were so high last June.
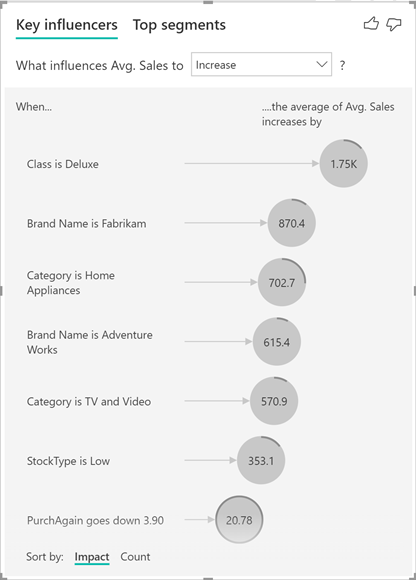
Treemap: Treemaps are charts of colored rectangles, with size representing the relative value of each item. They can be hierarchical, with rectangles nested within the main rectangles.
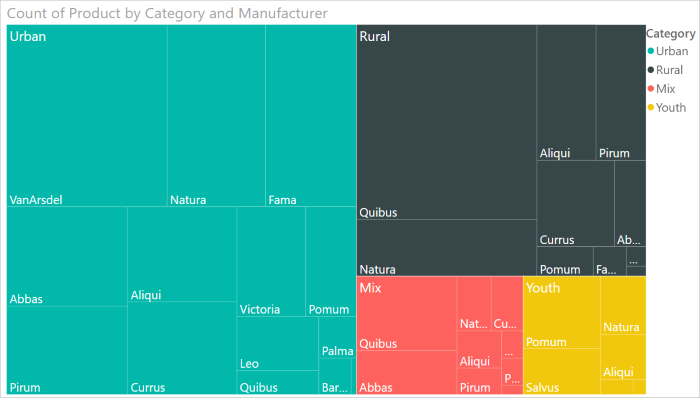
Scatter: A scatter chart shows the relationship between two numerical values. A bubble chart is a scatter chart that replaces data points with bubbles, with the bubble size representing an additional third data dimension.
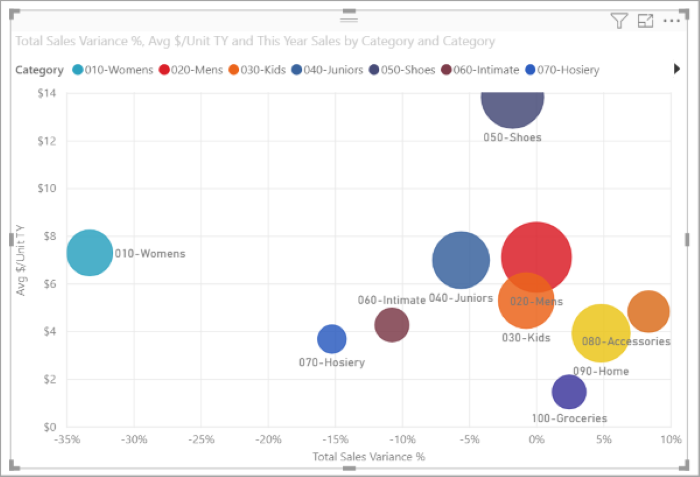
A dot plot chart is similar to a bubble chart and scatter chart, but can plot categorical data along the X-Axis.
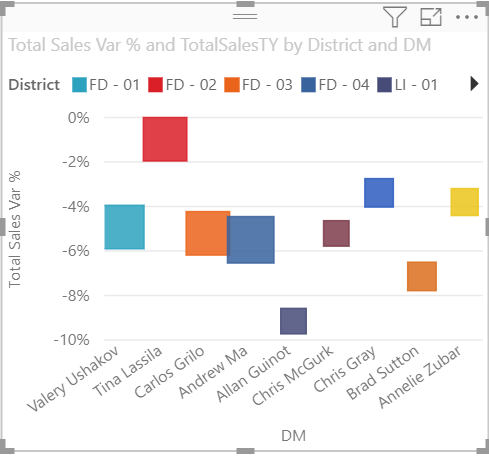
Filled map. If you have geographical data, you can use a filled map to display how a value differs in proportion across a geography or region. You can see relative differences with shading that ranges from light (less-frequent/lower) to dark (more-frequent/more).
Explore data analytics

Data analytics is concerned with examining, transforming, and arranging data so that you can study it and extract useful information. Data analytics is a discipline that covers the entire range of data management tasks. These tasks not only include analysis, but also data collection, organization, storage, and all the tools and techniques used.
The term data analytics is a catch-all that covers a range of activities, each with its own focus and goals. You can categorize these activities as descriptive, diagnostic, predictive, prescriptive, and cognitive analytics.
In this unit, you'll learn about these categories of data analytics.
Descriptive analytics

Descriptive analytics helps answer questions about what has happened, based on historical data. Descriptive analytics techniques summarize large datasets to describe outcomes to stakeholders.
By developing KPIs (Key Performance Indicators), these strategies can help track the success or failure of key objectives. Metrics such as return on investment (ROI) are used in many industries. Specialized metrics are developed to track performance in specific industries.
Examples of descriptive analytics include generating reports to provide a view of an organization's sales and financial data.
Diagnostic analytics

Diagnostic analytics helps answer questions about why things happened. Diagnostic analytics techniques supplement more basic descriptive analytics. They take the findings from descriptive analytics and dig deeper to find the cause. The performance indicators are further investigated to discover why they got better or worse. This generally occurs in three steps:
- Identify anomalies in the data. These may be unexpected changes in a metric or a particular market.
- Collect data that's related to these anomalies.
- Use statistical techniques to discover relationships and trends that explain these anomalies.
Predictive analytics

Predictive analytics helps answer questions about what will happen in the future. Predictive analytics techniques use historical data to identify trends and determine if they're likely to recur. Predictive analytical tools provide valuable insight into what may happen in the future. Techniques include a variety of statistical and machine learning techniques such as neural networks, decision trees, and regression.
Prescriptive analytics

Prescriptive analytics helps answer questions about what actions should be taken to achieve a goal or target. By using insights from predictive analytics, data-driven decisions can be made. This technique allows businesses to make informed decisions in the face of uncertainty. Prescriptive analytics techniques rely on machine learning strategies to find patterns in large datasets. By analyzing past decisions and events, the likelihood of different outcomes can be estimated.
Cognitive analytics
(unstructured hypothesis)

Cognitive analytics attempts to draw inferences from existing data and patterns, derive conclusions based on existing knowledge bases, and then add these findings back into the knowledge base for future inferences--a self-learning feedback loop. Cognitive analytics helps you to learn what might happen if circumstances change, and how you might handle these situations.
Inferences aren't structured queries based on a rules database, rather they're unstructured hypotheses gathered from a number of sources, and expressed with varying degrees of confidence.

Effective cognitive analytics depends on machine learning algorithms. It uses several NLP (Natural Language Processing) concepts to make sense of previously untapped data sources, such as call center conversation logs and product reviews.
Theoretically, by tapping the benefits of massive parallel/distributed computing and the falling costs of data storage and computing power, there's no limit to the cognitive development that these systems can achieve.

Comments
Post a Comment